Visualizing the Flow of Energy-Related CO2 Emissions in the U.S.
This was originally posted on the Decarbonization Channel. Subscribe to the free mailing list to be the first to see graphics related to decarbonization with a focus on the U.S. energy sector.
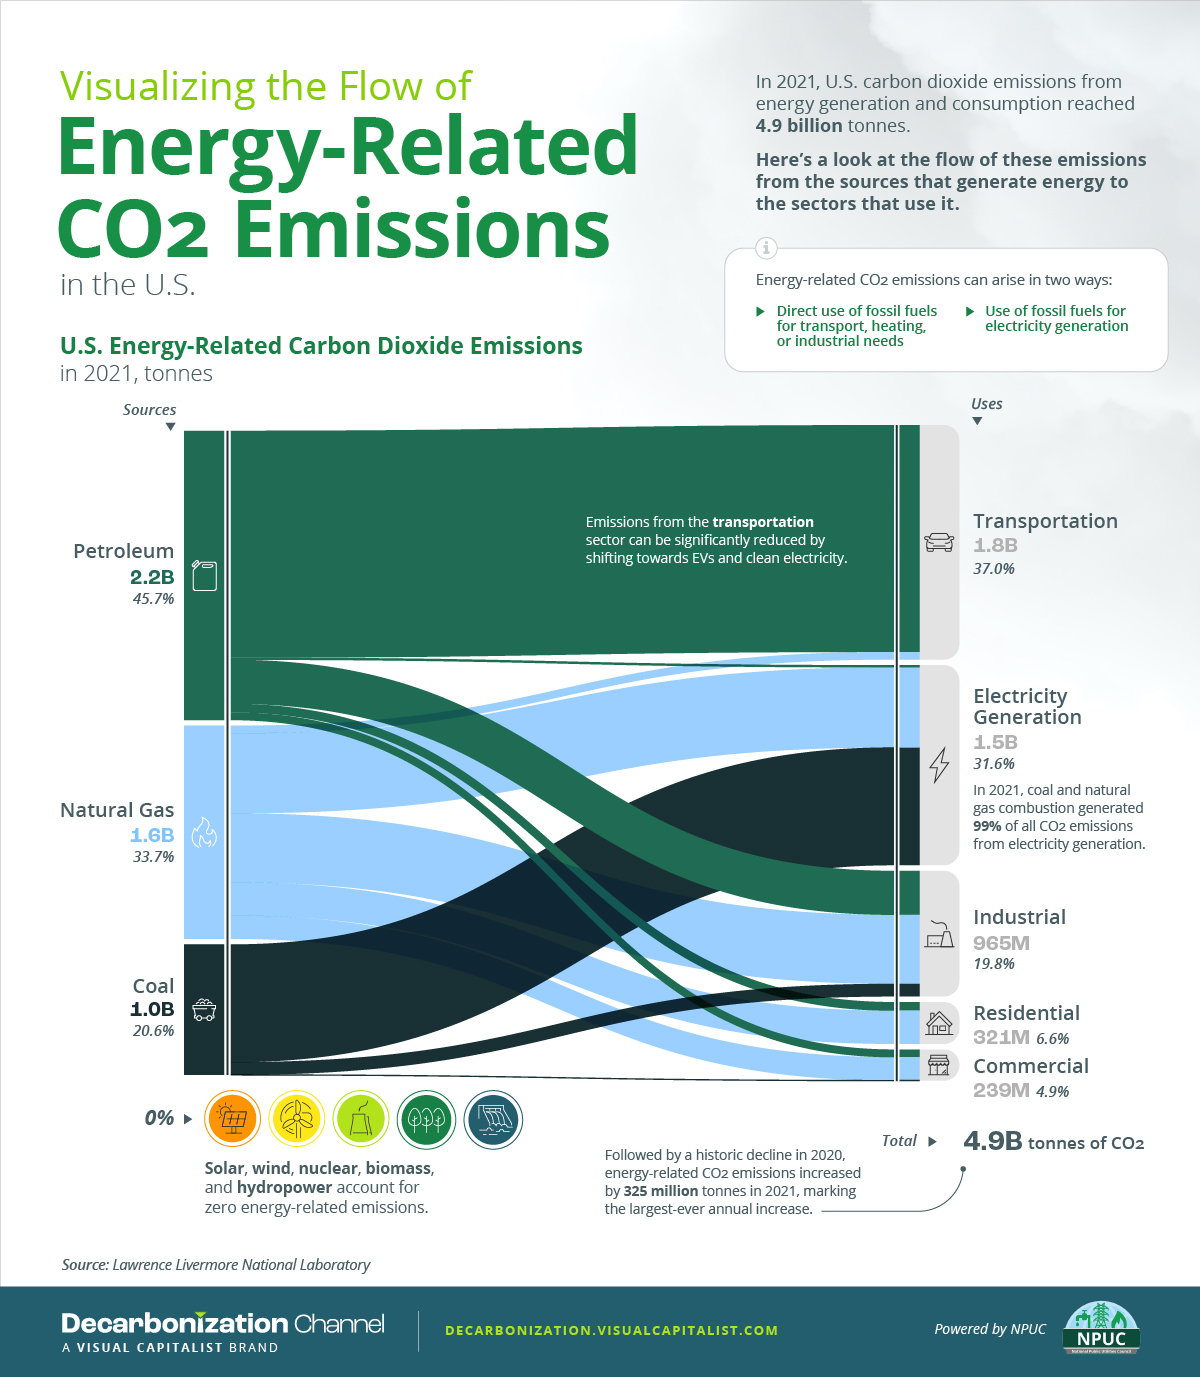
In 2021, U.S. carbon dioxide emissions from the generation and consumption of energy reached 4.9 billion tonnes.
To better understand how various energy sources and their end-uses contribute to carbon emissions, this graphic visualizes the flow of energy-related CO2 emissions in the U.S. using carbon flow charts by the Lawrence Livermore National Laboratory.
What are Energy-Related CO2 Emissions?
Energy-related CO2 emissions refer to the release of carbon dioxide as a result of the combustion of fuels to produce energy. They arise through the direct use of fossil fuels for transport, heating, or industrial needs, as well as the use of fossil fuels for electricity generation.
To provide some context, non-energy-related CO2 emissions are those that result from industrial chemical reactions, deforestation, and agricultural activities.
As the largest contributor to carbon emissions, however, energy-related CO2 emissions account for approximately 85% of all emissions in the U.S. which we will now explore in more detail.
U.S. Energy-Related CO2 Emissions in 2021
Followed by a pandemic-driven decline in 2020, energy-related carbon dioxide emissions in the U.S. increased by 325 million tonnes in 2021, marking the largest-ever annual increase.
| Energy Source | CO2 emissions in million tonnes, 2021 | % of total energy-related emissions |
|---|---|---|
| Petroleum | 2,223 | 45.7% |
| Natural Gas | 1,637 | 33.7% |
| Coal | 1,003 | 20.6% |
| Solar, Wind, Nuclear, Hydro, and Biomass | 0 | 0% |
| Total | 4,863 | 100% |
When we follow the CO2 emissions from the above fossil fuels to their end uses, transportation and electricity generation stand out as the biggest contributors.
In 2021, these two sectors accounted for more than 68% of all energy-related emissions in the country, roughly emitting 3.3 billion tonnes of CO2.
| End-Uses | CO2 emissions in million tonnes, 2021 | % of total energy-related emissions |
|---|---|---|
| Transportation | 1,801 | 37.0% |
| Electricity Generation | 1,537 | 31.6% |
| Industrial Uses | 965 | 19.8% |
| Residential Uses | 321 | 6.6% |
| Commercial Uses | 239 | 4.9% |
| Total | 4,863 | 100% |
When it comes to transportation, petroleum accounted for 97% of emissions, largely due to motor gasoline and diesel consumption. On the other hand, coal and natural gas made up 99% of CO2 emissions related to electricity generation.
Due to its high carbon intensity, coal’s contribution to power sector emissions may also be of particular interest. As the share of coal rose from 20% to 23% in the U.S. electricity mix in 2021, electricity emissions from coal also increased for the first time since 2014.
Naturally, this shift raised the overall energy-related CO2 emissions in 2021. It also caused a 4% hike in the carbon intensity of the country’s electricity.
Lowering Emissions
To avoid the impacts of climate change, many countries and companies are working towards decarbonization across all sectors, which can largely be facilitated by reductions in energy-related carbon emissions.
Accounting for nearly 70% of all energy-related CO2 emissions, transportation and utilities can be important pillars in these efforts.
"flow" - Google News
March 30, 2023 at 07:28PM
https://ift.tt/pmNcsxW
Visualizing the Flow of Energy-Related CO2 Emissions in the U.S. - Visual Capitalist
"flow" - Google News
https://ift.tt/taJSiwQ
https://ift.tt/W9ZF7KR
Bagikan Berita Ini


0 Response to "Visualizing the Flow of Energy-Related CO2 Emissions in the U.S. - Visual Capitalist"
Post a Comment